
Censorship by the numbers
A handful of people should not be allowed to dictate what the rest of us can read! Organized groups have used fear and disinformation to silence stories and remove books from our libraries, schools, and bookstores. Why can’t they just let books be?
Books are for everyone. Books should be read. Books should be uncensored. Let Books Be. Protect the Freedom to Read.
CENSORSHIP BY THE NUMBERS
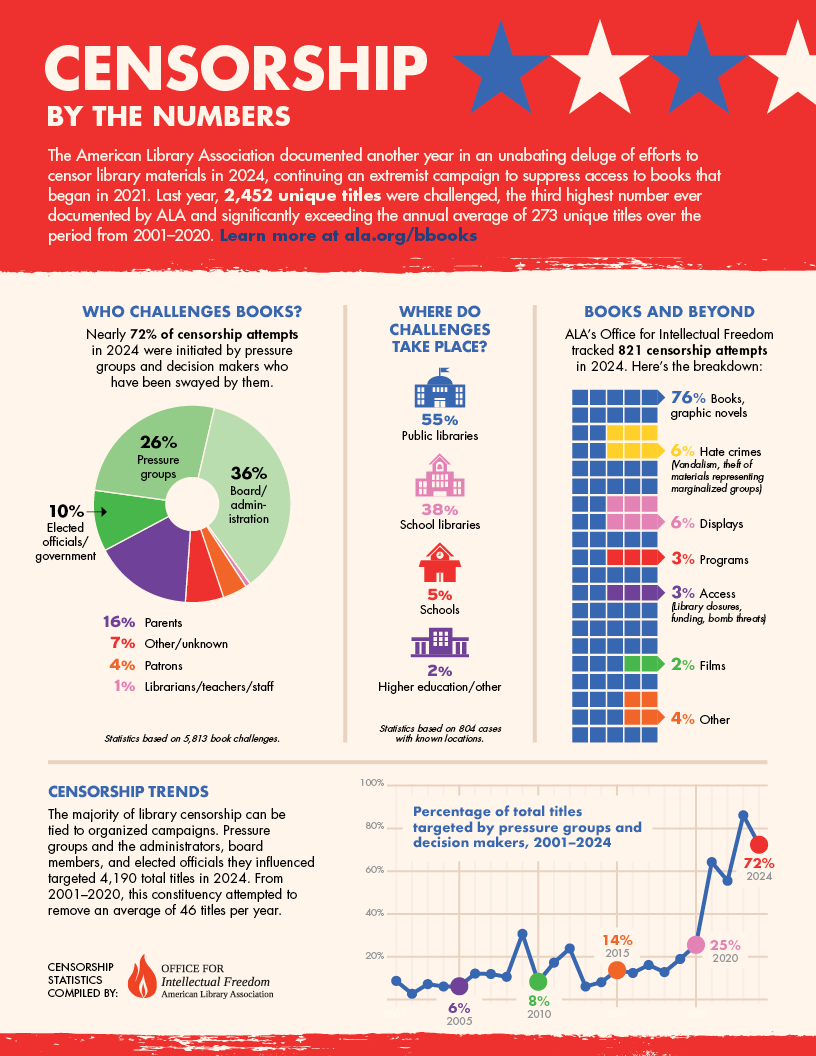
In 2005, the American Library Association documented the second highest level of book censorship attempts ever and the continuation of an organized effort to systematically suppress voices and ideas that began in 2021. Last year, 4,235 unique titles were challenged, only five titles short of the highest number ever documented by ALA and significantly exceeding the annual average of 273 unique titles over the period from 2001-2020.
Learn more at ALA.ORG/BBOOKS
WHO CHALLENGES BOOKS
Nearly 92% of censorship attempts in 2025 were initiated by pressure groups and decisions makers swayed by them. This marks a 20-point increase over 2024.
40% - Board/Administration
31% Elected Officials/government
21% Pressure groups
4% Other/unknown
3% Parents
1% Patrons
Statistics based on 8,596 total titles targeted for censorship.
BOOKS AND BEYOND
ALA’s Office for Intellectual Freedom tracked 713 distinct censorship incidents in 2025. Here’s the breakdown:
68% Books, graphic novels
13% Access (Library closures, funding, bomb threats)
5% Displays
4% Programs
2% Online resources/databases
2% Hate crimes (vandalism, theft of materials representing marginalized groups)
1% First Amendment Audits
1% Films
4% Other
WHERE CHALLENGES HAPPEN
51% Public Libraries
37% Schools
8% School Curricula
3% Higher education
Statistics based on 696 incidents with known locations and include challenges to all materials and services. About 1% of censorship attempts took place in other locations)
CENSORSHIP TRENDS
The majority of library censorship remains tied to organized campaigns. Pressure groups and the decision makers they influence targeted 7,884 total titles in 2025. From 2001-2020, this constituency tried to remove an average of 46 titles per year. From 2021-2025, they targeted an average of 5,238 total titles annually.
PERCENTAGE OF TOTAL TITLES TARGETED BY ORGANIZED CAMPAGINS, 2001-2025
6% 2005
8% 2010
14% 2015
25% 2020
92% 2025
WHO CHALLENGES BOOKS
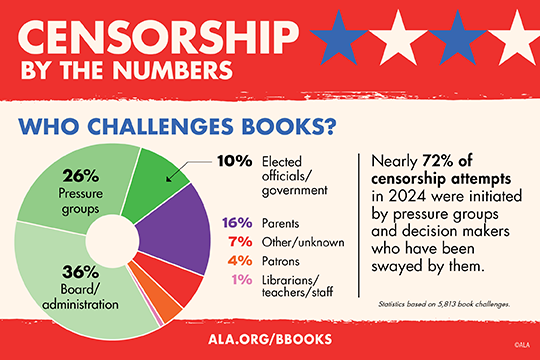
Nearly 92% of censorship attempts in 2025 were initiated by pressure groups and decisions makers swayed by them. This marks a 20-point increase over 2024.
40% - Board/Administration
31% Elected Officials/government
21% Pressure groups
4% Other/unknown
3% Parents
1% Patrons
Statistics based on 8,596 total titles targeted for censorship.
Nearly 92% of censorship attempts in 2025 were initiated by pressure groups and decisions makers swayed by them. This marks a 20-point increase over 2024.
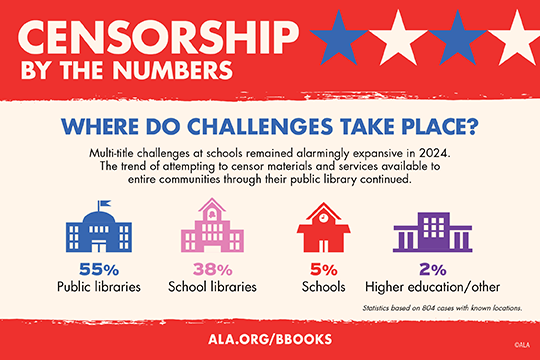
WHERE CHALLENGES HAPPEN
51% Public Libraries
37% Schools
8% School Curricula
3% Higher education
Statistics based on 696 incidents with known locations and include challenges to all materials and services. About 1% of censorship attempts took place in other locations)
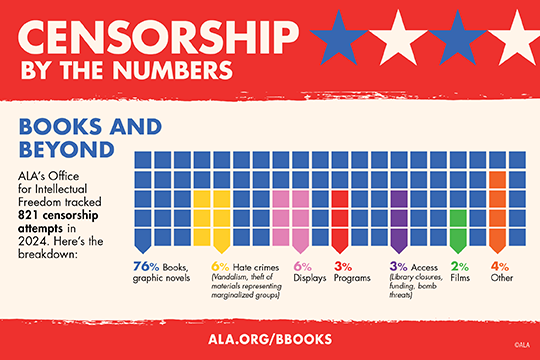
BOOKS AND BEYOND
ALA’s Office for Intellectual Freedom tracked 713 distinct censorship incidents in 2025. Here’s the breakdown:
68% Books, graphic novels
13% Access (Library closures, funding, bomb threats)
5% Displays
4% Programs
2% Online resources/databases
2% Hate crimes (vandalism, theft of materials representing marginalized groups)
1% First Amendment Audits
1% Films
4% Other
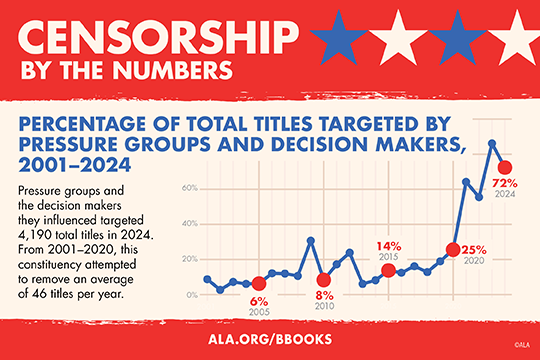
PERCENTAGE OF TOTAL TITLES TARGETED BY ORGANIZED CAMPAGINS, 2001-2025
6% 2005
8% 2010
14% 2015
25% 2020
92% 2025
Pressure groups and the decision makers they influence targeted 7,884 total titles in 2025. From 2001-2020, this constituency tried to remove an average of 46 titles per year. From 2021-2025, they targeted an average of 5,238 total titles annually.